The short version
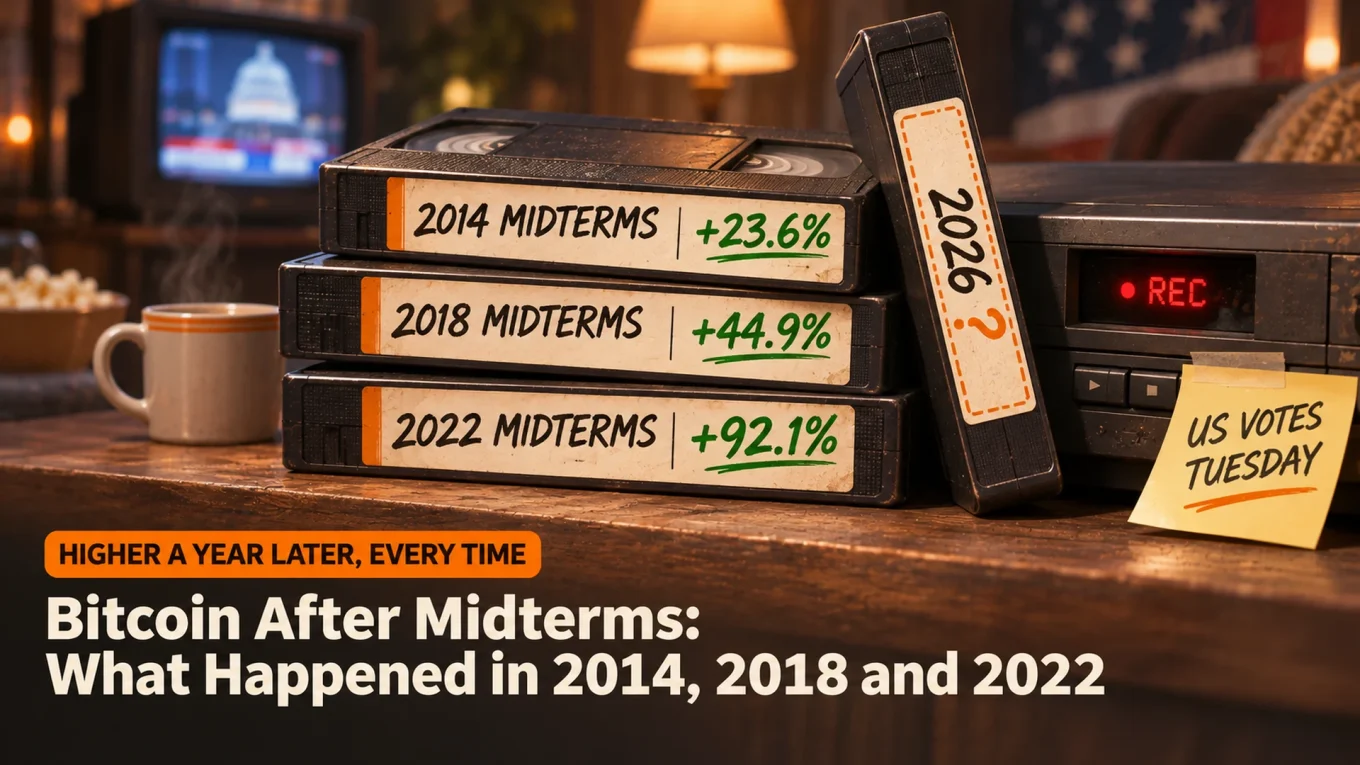
- Bitcoin after midterms: one month after the 2014, 2018 and 2022 votes BTC was +11.8%, −46.7% and −7.1%, and one year later it was higher every time, by 23.6% to 92.1%.
- Each past midterm fell 10 to 12 months after a cycle top and the bear low came within about ten weeks; this time Bitcoin is 38% under its $126,080 high, not 70%.
- Next: the vote on Tuesday, with the first polls closing at 23:00 UTC, and whether BTC holds the October low at $76,326. Follow Base Camp on X for the results as they move the market.
Bitcoin after midterms has a short but loud record. Americans vote on Tuesday, November 3, and BTC goes into it at $78,340, about 38% under its all-time high. The three Bitcoin midterm elections with a real market behind them went three different ways in the first month, from +12% to −47%.
A year later, though, Bitcoin was higher every single time. So is the vote the trigger, or just a date that happens to sit at the same point of every four-year cycle? And how well does 2026 match the three before it?
Benjamin Cowen, who has tracked the midterm-year pattern all year, put the trader’s version of the question plainly on Friday:

This should go without saying, but usually the time to sell Bitcoin (if you are going to) is Q4 of post-halving years, not during the Q4 dump of midterm years.
Usually the Q4 dump of midterm years just provide opportunities to buy for those who sold long ago.
While many people
Bitcoin After Midterms: How Did Past Votes Go?
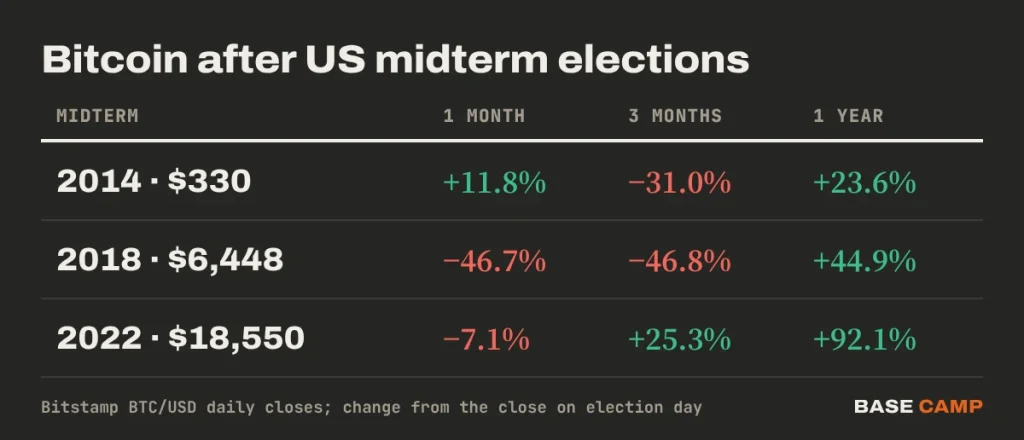
Badly at first, then well. Bitcoin was lower one month after two of the last three midterms and lower three months after two of them, but higher one year later in all three, by 24% to 92%.
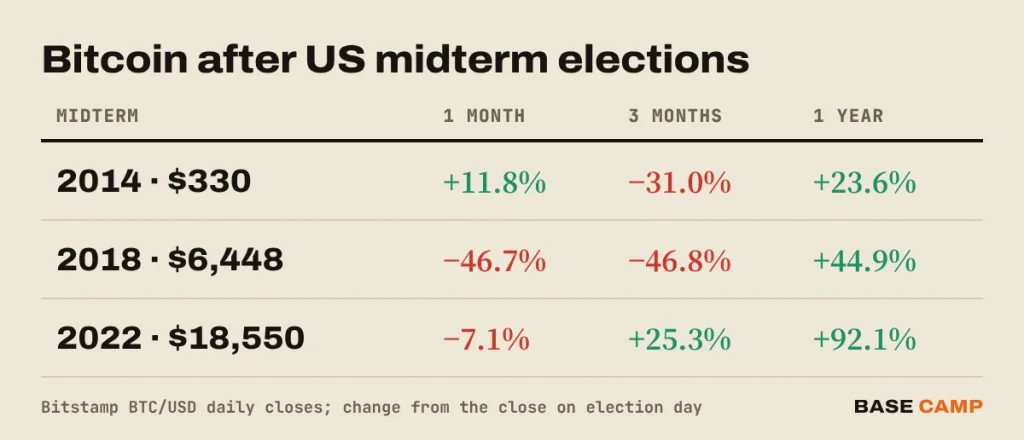
Each of those months had its own story, and none of them was about who won Congress:
- 2014: Bitcoin jumped 12% in the week after the vote, then gave it all back and more. It hit $152 on January 14, 2015, 54% under its election-day close, the low of the long bear market that followed the Mt. Gox collapse.
- 2018: a quiet week, then the Bitcoin Cash hash war in mid-November split that chain and broke Bitcoin’s $6,000 floor. BTC fell 47% in a month and bottomed at $3,122 on December 15.
- 2022: election day was the day Binance said it would buy FTX. It walked away the next day, FTX collapsed, and Bitcoin bottomed at $15,479 on November 21, 17% under its election-day close.
Bitcoin also existed for the 2010 midterms, but it traded for well under a dollar on a handful of tiny exchanges, so that year says little about today.
Sponsored · Affiliate link
Save 20% on fees trading on WEEX
Base Camp may earn a commission if you sign up. It never affects what we write.
Why Did Bitcoin Bottom After Every Midterm?
Because of where the four-year cycle stood, not because of the vote. Each past midterm came 10 to 12 months after a cycle top, with Bitcoin already 67% to 73% down, and the bear market low followed within about ten weeks.
The dates behind each Bitcoin cycle bottom line up almost too neatly. Bitcoin topped on November 30, 2013, December 17, 2017 and November 10, 2021, each time about a year before the next midterm. The bear lows then came 71 days, 39 days and 13 days after the vote. From there, the next halving was less than two years away each time, and the new uptrend ran into it.
SIDE TRAIL: Midterms and Crypto: What’s at Stake on Tuesday
Stocks have a sturdier version of the same habit. We checked every midterm since 1950: the S&P 500 was higher one year after election day in all 19, by 1% (1986) to 31% (1954). The usual explanation is that the uncertainty clears and a divided Congress passes fewer surprises. With 19 cases out of 19, that pattern has some weight. With three, Bitcoin’s version is a coincidence of calendars until it repeats.
What the vote can change is crypto policy. Kalshi traders give Democrats about a 94% chance of winning the House and 73% for the Senate, and a new House majority would pick the committee chairs who write the next crypto bills. That plays out over months of committee work, long after the results are in.
Does 2026 Fit the Midterm Pattern?
The timing matches. The depth doesn’t, at least so far. Bitcoin set its all-time high of $126,080 on October 6, 2025, about 13 months before this vote, right where the other three cycle tops sat. But it sits 38% under that high, where the other three sat roughly 70% down by their votes.
There are two ways to read that gap:
- The cycle is milder. Bitcoin already had its deep low on July 1, 2026 at $57,800, 54% under the top, and the bounce from there is the recovery. Cowen’s post makes the same case: in his view the accumulation phase started on July 1, with room for a fourth-quarter drop like other midterm years.
- The low is still ahead. Past bear markets bottomed 77% to 87% under the top. A repeat of even the mildest one, 2022, would take BTC to about $28,000, which nothing on the chart points to today. The more useful lesson from 2022 is the speed: the low came two weeks after the vote, on news nobody saw coming.
For a Bitcoin midterm year, the halving clock fits the old script too. The next one is about 17 months away, in April 2028, close to the 17 to 20 months it was in past midterm years.
TRAIL MAP: Bitcoin Halving Cycle Explained With Data
Bitcoin Price Analysis: Levels Into the Vote
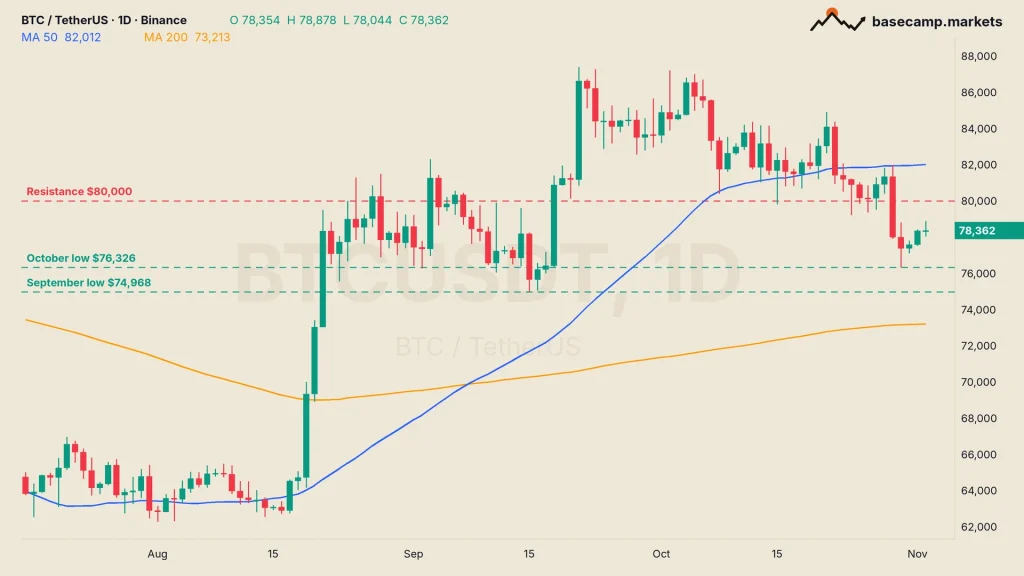
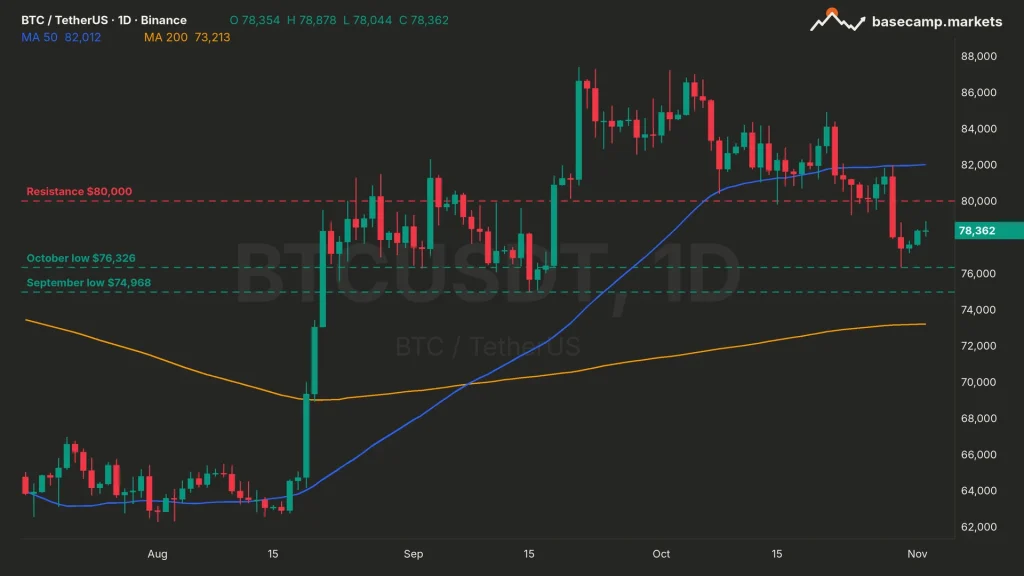
Bitcoin trades at $78,340 at the time of writing, 2.6% above the October low of $76,326 and 2.1% below $80,000. That is a narrow range for a week with a vote, Binance’s proof of reserves and a jobs report in it.
Above the price, $80,000 is the first ceiling, with the 0.236 Fibonacci retracement at $80,411 just over it. The 50-day moving average sits at $82,012. Below, the October low comes first, then the September low at $74,968 and the 200-day moving average at $73,213.
History says Bitcoin after midterms has had a good year every time. It also says the weeks right after one can be the worst of the cycle.

Teddy has been trading crypto since 2016. The focus is altcoins and EMA setups: finding coins sitting on key levels, waiting for support to hold or a range to be reclaimed, and trading the move from there. Bitcoin sets the tone, but the opportunities are usually in the alts.
More from Teddy