
The short version
- Bitcoin weekly candle: BTC needs a close above $78,354 by 00:00 UTC Monday (7:00 p.m. Sunday in New York) to avoid a fifth red week in a row, and trades near $75,921.
- A fifth would be only the fourth streak that long on Binance since 2017, and the mildest: 12.2% off the October 4 close, against 17.9% to 38.0% before.
- BTC still holds the 50-week moving average at $75,557, a line it spent 44 weeks under before reclaiming it in September.
Bitcoin needs a little over 3% before Sunday ends to dodge a fifth red week in a row. The Bitcoin weekly candle opened on Monday at $78,354 on Binance, and BTC trades at $75,921 at the time of writing.
A fifth straight red close would be only the fourth streak that long on Binance’s BTC/USDT chart since 2017. The week that got it here, in four lines:
1. Monday and Tuesday: a slow slide into the US midterms, with closes of $76,816 and $77,454. 2. Wednesday: a short squeeze lifted BTC to $81,196, the high of the week, and a close of $80,504. 3. Thursday: the post-election rally ended after one day. The Nasdaq 100 fell 6.4% and Bitcoin 5.5%, to $76,088. 4. Friday: a low of $74,888, about $80 under September’s low and the lowest price since August 21. US spot Bitcoin ETFs finished the week $1.28 billion in outflows.
Thursday’s turn, as we posted it the next morning:

Crypto's post-election rally lasted just one day
• Nasdaq 100 plunged 6.4%, its worst day since March 2020
• BTC fell 5.5%, ETH 7.7%
• $1.24B in crypto positions liquidated
• AI spending fears triggered the selloff
basecamp.markets/crypto-crash-n…
When Does the Bitcoin Weekly Candle Close?
The Bitcoin weekly candle closes at 00:00 UTC on Monday, which is 7:00 p.m. on Sunday in New York. Binance’s weekly candles run from Monday to Sunday in UTC, so the open of $78,354 is the line: a close above it turns the week green, and anything below prints another red weekly candle.
Five red weeks in a row have cost 12.2% so far, from the $86,530 close on October 4 to today’s price. None of the five was a crash on its own. The worst, the week of October 5, lost 3.2%; this one is down 3.1%, and the mildest lost 2.0%.
Sponsored · Affiliate link
Save 20% on fees trading on WEEX
Base Camp may earn a commission if you sign up. It never affects what we write.
How Rare Is a Fifth Red Week?
Very. In more than nine years of Binance data, Bitcoin has strung together five or more red weekly closes only three times. Counting this one, 12 streaks reached four red weeks; only three before it went on to a fifth.
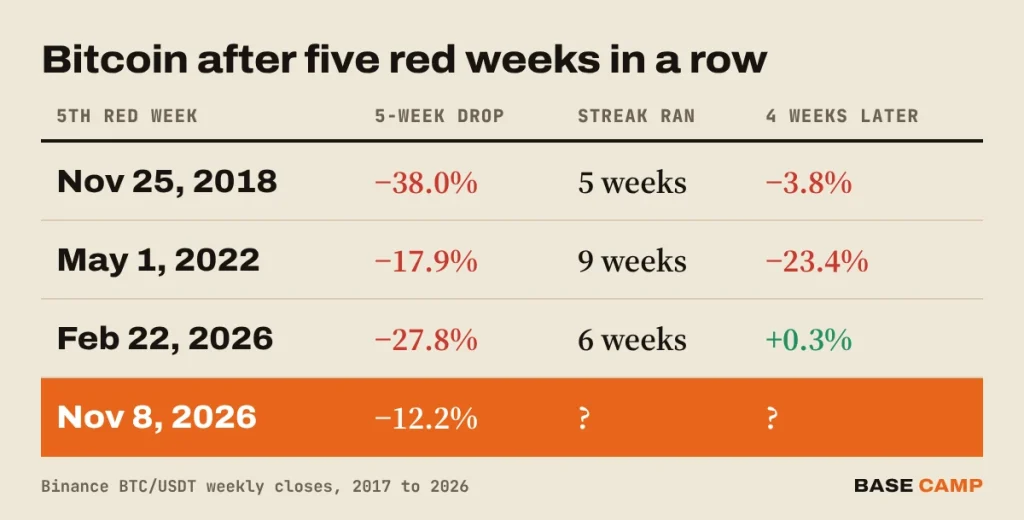
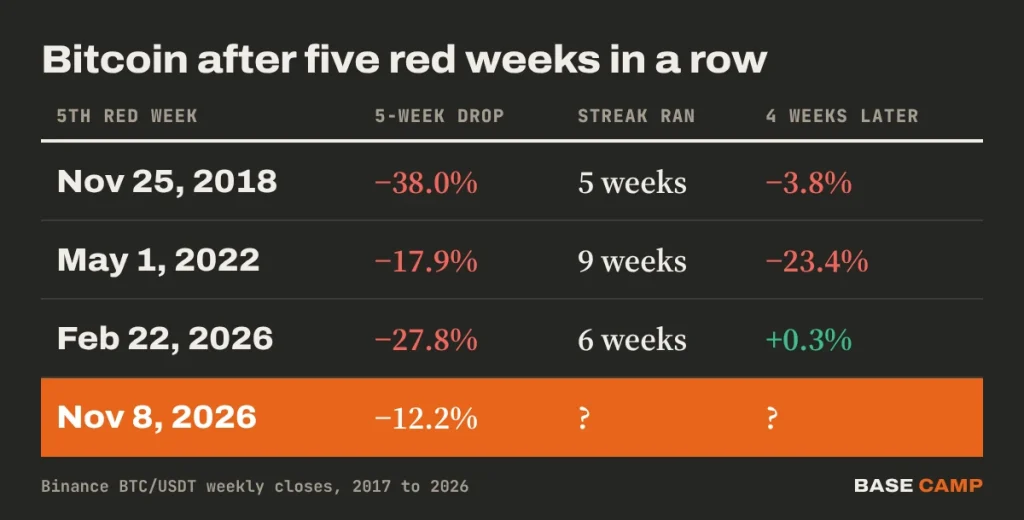
Three cases are a small sample, and none of them is comforting. In each one, BTC traded at least 7.6% below the fifth close within the next month. The 2018 streak came three weeks before that bear market’s bottom at $3,156 on December 15. The 2022 streak ran into the Terra collapse, and the February streak this year dipped to $62,510 two days later.
What sets this streak apart is its size. A 12.2% drop over five weeks is less than half of what the 2018 and February streaks cost, and well under the 17.9% of 2022. It is also the second streak of five or more red weeks this year.
SIDE TRAIL: Bitcoin Weekly Close: Fourth Red Week in a Row at $78,354
Bitcoin Price Analysis: Can BTC Hold the 50-Week Moving Average?
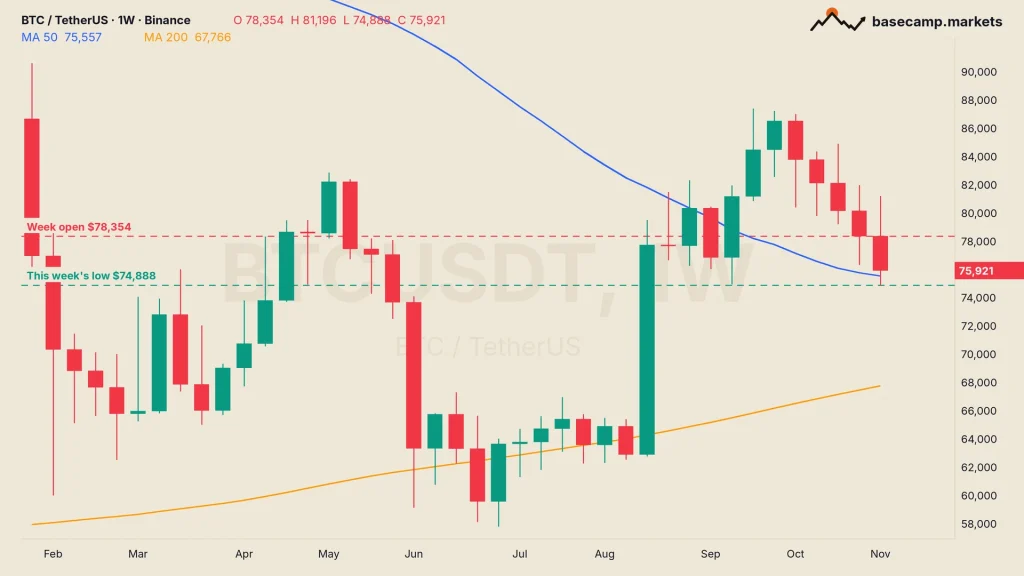
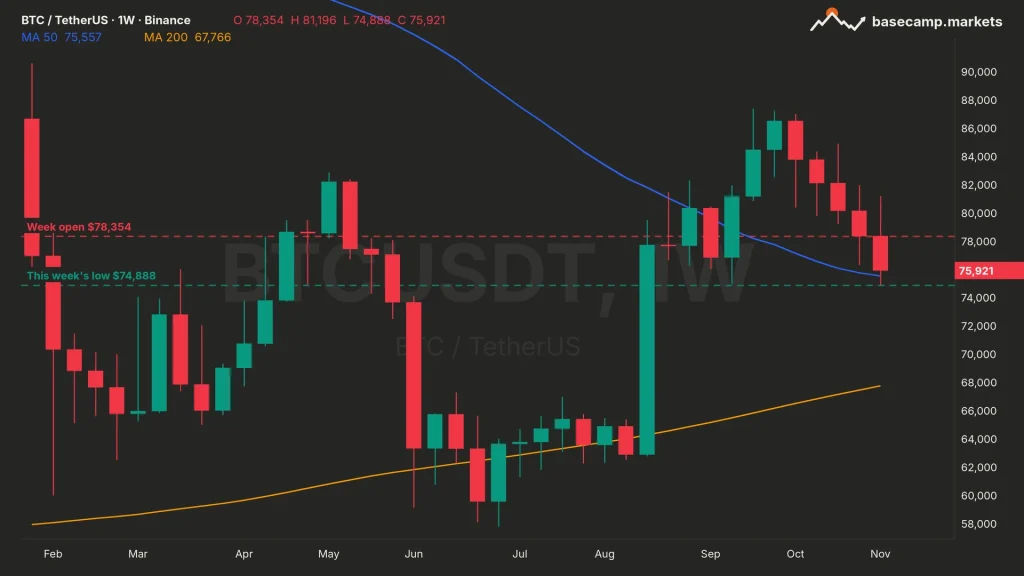
So far, yes, by about $400. The 50-week moving average, the mean of the last 50 weekly closes, sits at $75,557. Bitcoin lost it in November 2025, spent 44 weeks below it and only closed back above it in the week ending September 20. Every weekly close since has stayed over it, including the four red ones.
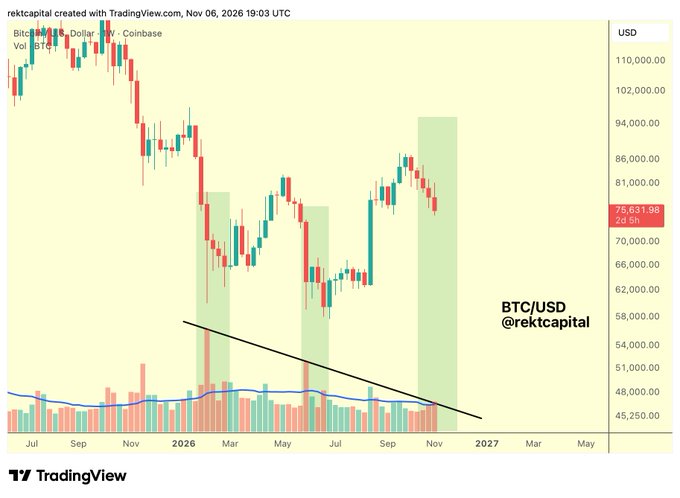
Volume tells a mixed story. On Binance spot, this week has traded about $7.6 billion so far, level with the quietest of the five red weeks, which is not what panic selling looks like. Rekt Capital sees seller volume picking up, but not yet at the size that usually marks capitulation:

#BTC
Bitcoin is slowly getting there when it comes to seller-dominant volume
Seller volume has just about eclipsed its moving average (blue MA on volume) to officially reach above-average territory
Thus, Seller volume has reached above-average volume for the first time on
The levels are close together:
- $78,354: this week’s open. A Bitcoin weekly close above it ends the streak.
- $75,557: the 50-week moving average. A close below it hands back the September reclaim.
- $74,888: Friday’s low, just under the September low of $74,968.
- $73,027: the August 21 low, the next one under that.
The 200-week average is far lower, at $67,766.
TRAIL MAP: Indicators Worth Knowing: Moving Averages, RSI and Volume
The next candle doesn’t wait long for news. October’s US inflation report lands on Tuesday at 13:30 UTC, 8:30 a.m. in New York, and Kalshi traders put about 57% on a monthly print above 0.2%.

Satoshi Flipper has more than 20 years of trading experience, starting in stocks before moving into crypto in 2017, and holds an MBA from the Kellogg School of Management. The edge is reading the economic data: rate decisions, inflation, jobs numbers, earnings and the US markets that move Bitcoin.
More from Satoshi Flipper